- Valuation Model
- Expert Interviews
- Founders, funding
What is the TAM of all contract workers in the United States?

Marcelo Ballvé
Head of Research at Sacra
See the link to our dataset at the bottom.
Here are the preliminary results of the sizing:
- Our expanded market-sizing conservatively shows a total market size of $50.4B, encompassing an estimated 29.97M workers who perform contingent work. More than half of these, or 18.79 are 1099 workers, while the balance are W2s. That includes:
- A $2.1B opportunity among real estate brokers and agencies
- A $2.7B opportunity in management, technical, and scientific consulting
- A $1.8B in employment and staffing
- Due to our analysis focusing on industries likely to use a high proportion of contingent work, the number of contingent W2s and 1099s as a proportion of the overall workforce within these categories was a relatively high 43%.
These data points also confirmed some early hypotheses on target markets. For example:
- An expert op-ed from April 2023 stated that 25% of nurses and nurse aides in post-acute healthcare settings are 1099 contractors.
- 58% of jobs on Zip Recruiter for virtual call centers were explicitly for contract positions, despite the platform overall being overwhelmingly focused on “full-time” positions.
- A 2022 report on 1099s using California tax data showed that already in 2016, 48.1% of real estate agencies’ total payroll dollars in the state went to 1099s. That percentage was 7.6% for ad agencies, 29.2% in financial transaction- and credit-card processing, and 11.4% in ambulatory healthcare, among other similar data points. But, we also know the average contractor only works a fraction of the year, and that contingent work has grown, particularly after COVID. So these figures can be stretched up to estimate today’s total number of 1099s in industries covered in this report.
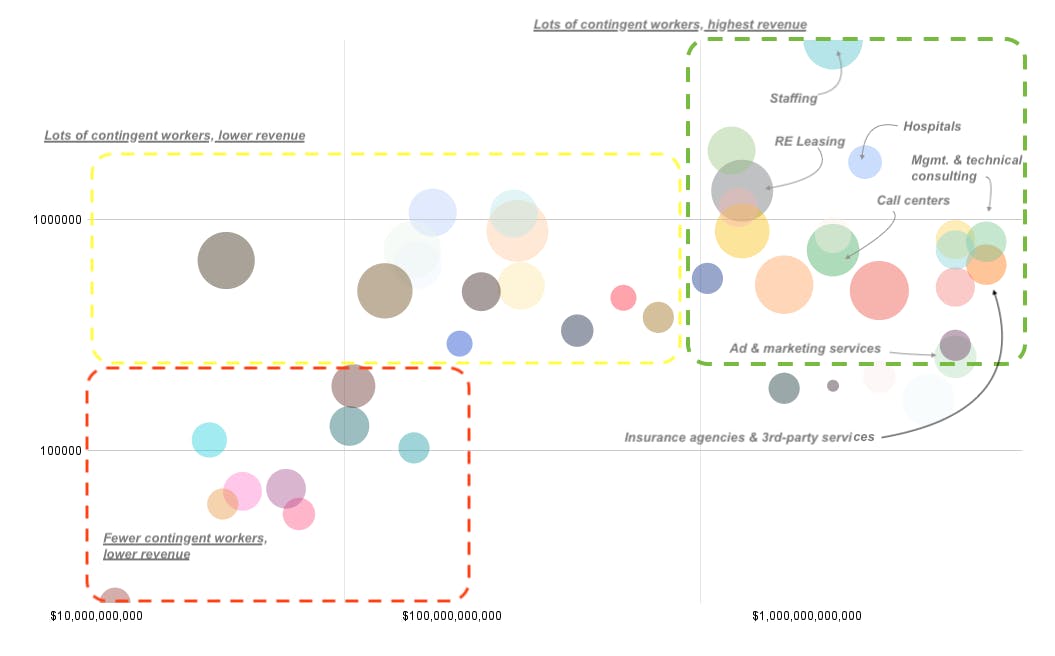
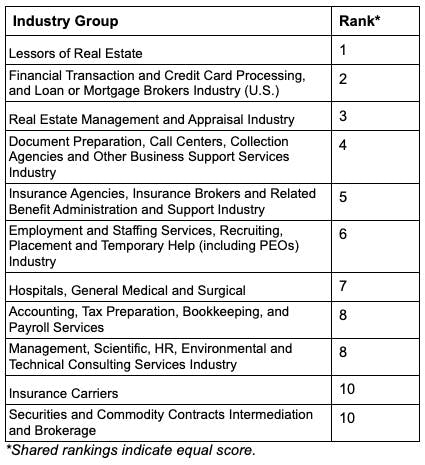
According to our ranking of market-attractiveness, Real Estate Leasing, Staffing and Employment Services, and the Financial Transaction and Credit Card-Processing categories were the three top-ranked target markets. The market-attractiveness index is a blended average of component indicators tied to the number and percentage of contingent workers in an industry, as well as the size of revenue and profit pools in the different industries.
Interestingly, Real Estate brokers fall out of the top 11, mainly due to lower revenue and profitability scores than other top categories. That said, this category still falls in the top half of categories for market attractiveness.
Note on the overall numbers of 1099s in the US
Academics have noted that BLS and Census data systematically undercounts the number of independent contractors and so skews data in key studies. The key reason, it turns out, is that individuals tend to self-identify as employees, even when their actual work situation tends to be mediated by a 1099 arrangement. This may be an important fact on which to educate investors or other financial stakeholders who try to arrive at estimates of the contractor workforce.
The most recent literature, from 2023, estimates that any official government data on independent contracting and 1099 work needs to be doubled to arrive at more accurate estimates on the prevalence of independent contracting overall and in specific verticals. A study by the Upjohn Center for Employment Research put the overall figure of independent contractors in the US workforce at 15 percent of the workforce, but this is based on lagged data, so we used 17 percent as the average across all industries.
Methodology
We established NAICS sectors with a high preponderance of contingent work in interviews and using IRS and California tax data. Then, we zeroed in on 7 sectors to identify industries worth focusing on further.
Within these sectors we identified 44 NAICS Industry Group categories, with desirable characteristics.
Having done this, we collected industry group-level data from market-research databases to populate columns such as the total number of employees, revenue, and profitability. Data points such as sales-per-firm might also become interesting if we later look at the level of market concentration in each industry.
The key step and most laborious was to look for indicators and data points regarding the preponderance of 1099 work and contingent work in general in each industry. The idea was to ground the estimate of 1099s in real-world, empirical data wherever possible. For W2s, the estimate follows that of 1099s. The principle is that in high-1099 categories, a large proportion of employees are engaged in similar work across tax treatments. Several key studies helped in arriving at the multipliers.